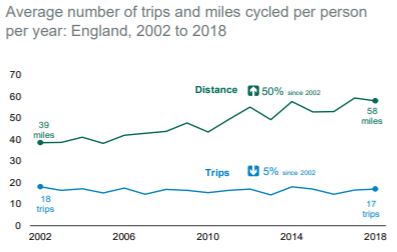
There has been much in the news lately about the low levels of cycling and the reasons behind those levels. Below is a chart that presents the average number of trips and miles cycled between 2002 and 2018.
 There was a recent traffic survey on Prospect in Corsham just north of the Dicketts Road turning that makes interesting reading as its a gateway into Corsham from the south and leads to Corsham Primary School and St. Patricks Primary School.
The results of the survey for the 7-day period from 07/10/2019 to 13/10/2019 are as follows:
• Speeds for a total of 30,191 vehicles in free-flowing traffic in both directions were recorded.
• Total traffic volume during this period was 42,102 vehicles. (This figure may be higher than above due to congestion when ‘free-flowing’ speeds cannot be recorded.)
• The 85th percentile speed was 35.9mph. This is the speed at or below which 85% of the traffic is travelling and is used nationally as a criterion for Community Speed Watch interventions.
• The mean speed was 31.6mph. 62.8% of recorded vehicles were exceeding the posted speed limit. The mean speed of these vehicles was 34.1mph
Yes 62.8% of all vehicles were braking the speed limit! The maximum speed recorded was 77.9mph southbound and 70.7mph northbound but its the speeds between 8am and 9am and 3pm and 4pm which are of particular interest as this aligns to the school run.
The Southbound and Northbound ‘Virtual Day’ where all the speeds across each of the days are normalised are presented below
The figures show a persistent volume of traffic throughout the day with significant numbers over 35 mph. A 20mph zone has been proposed for school run times that would be similar to that on Lacock Road.
The question is why are there so many speeding vehicles so near a school.
The survey results can be found in the zip file below